镧系离子电荷转移能理论研究进展
这里主要参考的是学位论文《镧系离子的电荷转移研究》中的内容(P19)
Jørgensen’s model
This model is based on optical electronegativity empirical calculation.
In 1962, Jørgensen firstly attributed the moderately strong, very broad absorption bands observed in dilute LnBr3 (Ln = Nd(Ⅲ), Sm(Ⅲ), Eu(Ⅲ), Tm(Ⅲ) and Yb(Ⅲ)) solutions in nearly anhydrous ethanol to the electron trasnsfer from the ligand to the trivalent lanthanide ions.[1] One can roughly estimate the energy of charge transfer transition energy from the optical electronegativity concept introduced by Jørgensen as shown below: [2] $$E^{\mathrm{CT}}=3.72\left[\chi_{\mathrm{opt}}(X)-\chi_{\mathrm{uncorr}}(M)\right]$$where \(\chi_{\text {opt }}(X)\) and \(\chi_{\text {uncorr }}(M)\) are the optical electronegativity of the ligand and central metal ions, respectively. The constant 3.72 in above equation adapts electronegativity to the \( \mathrm{eV}\) scale. Krumpel et.al have proposed a correction to this equation that accounts for size varaitions of the site, where lanthanide ion is located.[4] This enabled the comparison between ECT values of similar phosphors. Paper [7] shows the example of using this model.
- 注意计算用的是离子的电负性,而不是元素的电负性,不能简单参考鲍林电负性表;
- 上面公式对应的能量单位是eV,如果括号外面的数是3000,那么最后的能量单位是波数;
- “Uncorrected” means that the contributions of spinpairing energy and other interelectronic repulsion parameters, as well as relativistic effects are not taken into account. [16]
- For \(\chi_{\text {opt }}(X)\), the values of the Pauling electronegativity can be used: F− (3.9), Cl− (3.0), Br− (2.8) and I− (2.5). 这几个数值都和鲍林电负性表数据一致(原子) \(\chi_{\text {uncorr }}(M)\) is a value that must be determined empirically from the observed charge-transfer energies. For Eu3+, a \(\chi_{\text {uncorr }}(Eu)\) value of 2.0 can be taken.
- 不适用于氧化物,the application of formula is largely restricted to halide compounds. It does not work to predict the charge-transfer energies of oxides. [16] 但是参考文献[7]还是将其用在氧化物。
- G.Blasse在文献[The europium(III)—fluorine charge-transfer transition-1989]中使用了该公式,也说明了该公式不适用于氧化物,因为\( \chi_{\mathrm{opt}}(O)\)在不同氧化物中差别很大。
- 文献[Red shift of CT-band in cubic Y2O3: Eu3+ upon increasing the Eu3+ concentration. ECS Journal of Solid State Science and Technology-2016]又指出这个公式可以用,还给出了\( \chi_{\mathrm{opt}}(O)\)的值。
- Dorenbos: pointed out that this equation necessarily has a limited scope, because it does not account for the size and the binding strength of the valence band electrons.[3]
Boutinaud’s IVCT model
This model is based on atom distance.
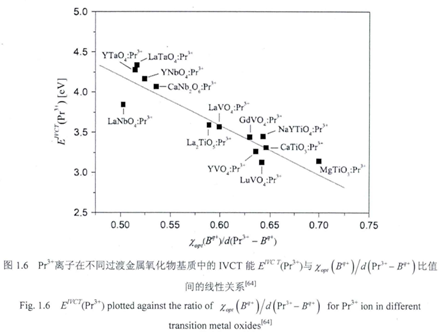
For lantransition doped metal oxide, ther exist a special case for electron transfer, i.e., eletron transfer from lanthanide ion to the transition metal in the host, is often referred to as an intervalence-charge transfer(IVCT). Boutinaud and co-workers proposed an empirical model to calculate the IVCT energy based on the their research on Pr3+/Tb3+ related IVCT behavior.[8] [9] In his model, both the so-called optical electronegativity and the distance between lanthanide (Pr3+/Tb3+) and transition metal are used to position the IVCT state (Pr3+ as an example): [10] $$\operatorname{IVCT}\left(\mathrm{cm}^{-1}\right)=58800-49800\left[\chi\left(\mathrm{TM}^{\mathrm{n}+}\right)\right.\left./ d_{\min }\left(\operatorname{Pr}^{3+}-\mathrm{TM}^{\mathrm{n}+}\right)\right]$$where \(\chi \mathrm{TM}^{\mathrm{n}+} \) is the optical elecronegativity of, \(d_{\min }\) is the shorest distance between TMn+ and Pr3+. Figure XX gives the linear relastionship between x/d and IVCT energy of Pr3+/ Tb3+ in different hosts.[8] the accuracy of this model is of the order of ±1500 cm−1 (about 0.2 eV), surprisingly good if one considers the actual complexity of the problem.[8]
 Paper [10] [11] shows the example of using this model.
Dorenbos’s model model
This model is based on statistical analysis.
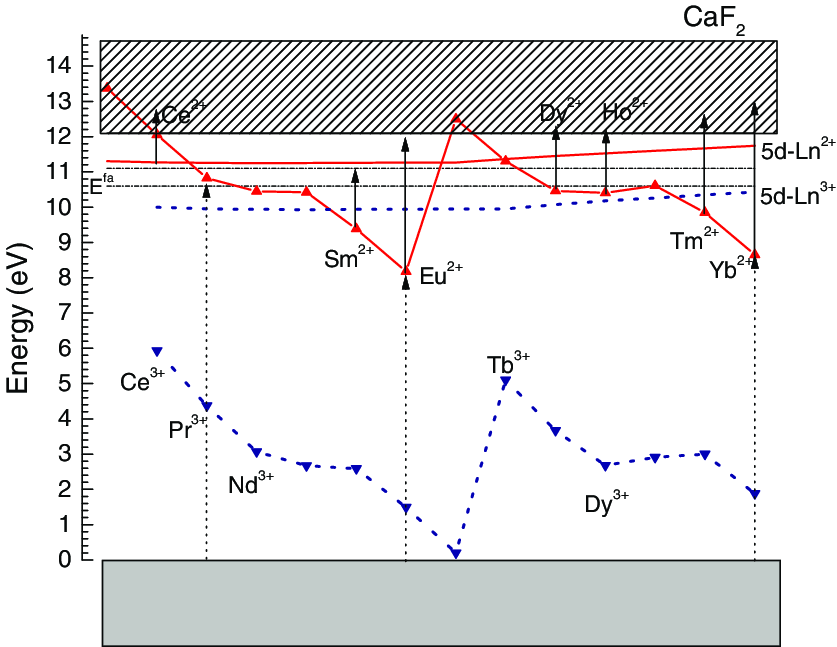
By collecting plenty of data on charge transfer energy for trivalent lanthanides(Eu3+/Yb3+/Sm3+/Tm3+) in many different compounds, he observed that CT-band energy to a trivalent lanthanide is always a fixed amount of energy larger than to Eu3+ when in the same site of the same compound.[12][13][14][15] The energy level positions for each trivalent/divalent lanthanide can be fixed by three host dependent parameters: (1) the band gap of the host compound, (2) the CT energy for Eu3+, and (3) the redshift of the fd transition in that compound. [13] Normally, the calculation starts from the CT energy for Eu3+, then the fixed difference between the energy of CT to a trivalent ion with that to Eu3+ can be exploited to locate the ground state of the divalent lanthanide ion by the following equation: $$E_{\mathrm{Vf}}(n+1,2+, A) \approx E^{\mathrm{CT}}(n, 3+, A)=E^{\mathrm{CT}}(6,3+, A)+\Delta E^{\mathrm{CT}}(n, 6,3+)$$where n is the number of 4f electrons for lanthanide ions, A is the host, Evf is the energy difference between the top of the valence band and the 4f ground state of Ln2+(Ln3+ get one electron), ECT(n, 3+, A) is the CT energy for Ln3+, ΔECT is the difference between the energy CT to the trivalent lanthanide with that to Eu3+ averaged over all compounds A for which data are available.[13] Fig xx is the energy-level schemes of divalent and trivalent lanthanides in CaF2.[13, 15] The location of the divalent/trivalent follow a characteristic double zigzag cure pattern, which holds ture for the case of other matrix host.
参考文献:
[1] Electron transfer spectra of lanthanide complexes
[2] Modern aspects of ligand field theory
[3] The charge transfer energy and the relation with the band gap of compounds
[4] Charge transfer transitions in the transition metal oxides ABO4:Ln3+ and APO4:ln3+ (A=La, Gd, Y, Lu, Sc; B=V, Nb, Ta; Ln=lanthanide)
[5] 镧系离子的电荷转移研究-P19
[6] Red Shift of CT-Band in Cubic Y2O3:Eu3+ upon Increasing the Eu3+ Concentration
[7] Spectral and kinetic characterization of orange-red emitting Sr3Al2O6:Eu3+/Sm3+ phosphor
[8] Emission quenching induced by intervalence charge transfer in Pr3+- or Tb3+-doped YNbO4 and CaNb2O6
[9] Luminescence properties of Pr3+ in titanates and vanadates: Towards a criterion to predict 3P0 emission quenching
[10] Excitation Wavelength Dependent Luminescence of LuNbO4:Pr3+-Influences of Intervalence Charge Transfer and Host Sensitization
[11] The design of dual-switch fluorescence intensity ratio thermometry with high sensitivity and thermochromism based on a combination strategy of intervalence charge transfer and up-conversion fluorescence thermal enhancement
[12] A Review on How Lanthanide Impurity Levels Change with Chemistry and Structure of Inorganic Compounds
[13] Systematic behaviour in trivalent lanthanide charge transfer energies
[14] Lanthanide level location in transition metal complex compounds
[15] Locating lanthanide impurity levels in the forbidden band of host crystals
[16] Interpretation of europium(III) spectra-Koen Binnemans-Coordination Chemistry Reviews-2015