色坐标的由来
- chromaticity 色度
- Gamut 色域
- hue
- saturation
- lightness
- brightness
参考:
LMS Color Space
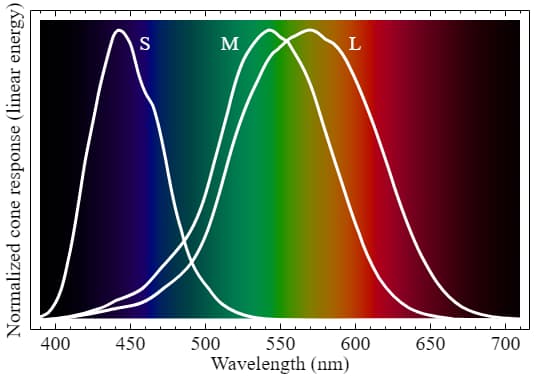
人眼的三种cone cells响应光谱(归一化)如上图所示,存在一定的重叠区域。人眼看到的任何颜色都可以用三个数值来表示,这三个数值分别对应三种视锥细胞的响应数值。注意同样的三个数值(同样的颜色)可能对应不同的光谱形状,专业的说法叫【metamerism】(条件等色,同色异谱),这类似能级简并、同素异形体或者化学异构等概念。现代的显示器只是保证还原这三个数值,以保证你看到的是同样的颜色,而不是recreat the spectrum。
 注意这里的SML曲线进行了面积的归一化,即保证曲线下围成的面积相等,(似乎Jamie Wong这里没有考虑本身不同的灵敏度差异,不过不影响最后分析)。上面的柠檬的反射光谱实际上和外界光源有很大关系,下面的显示器显示的颜色是复刻在该特定光源照射下柠檬呈现的颜色 (S=0.02, M=0.12, L=0.16)。
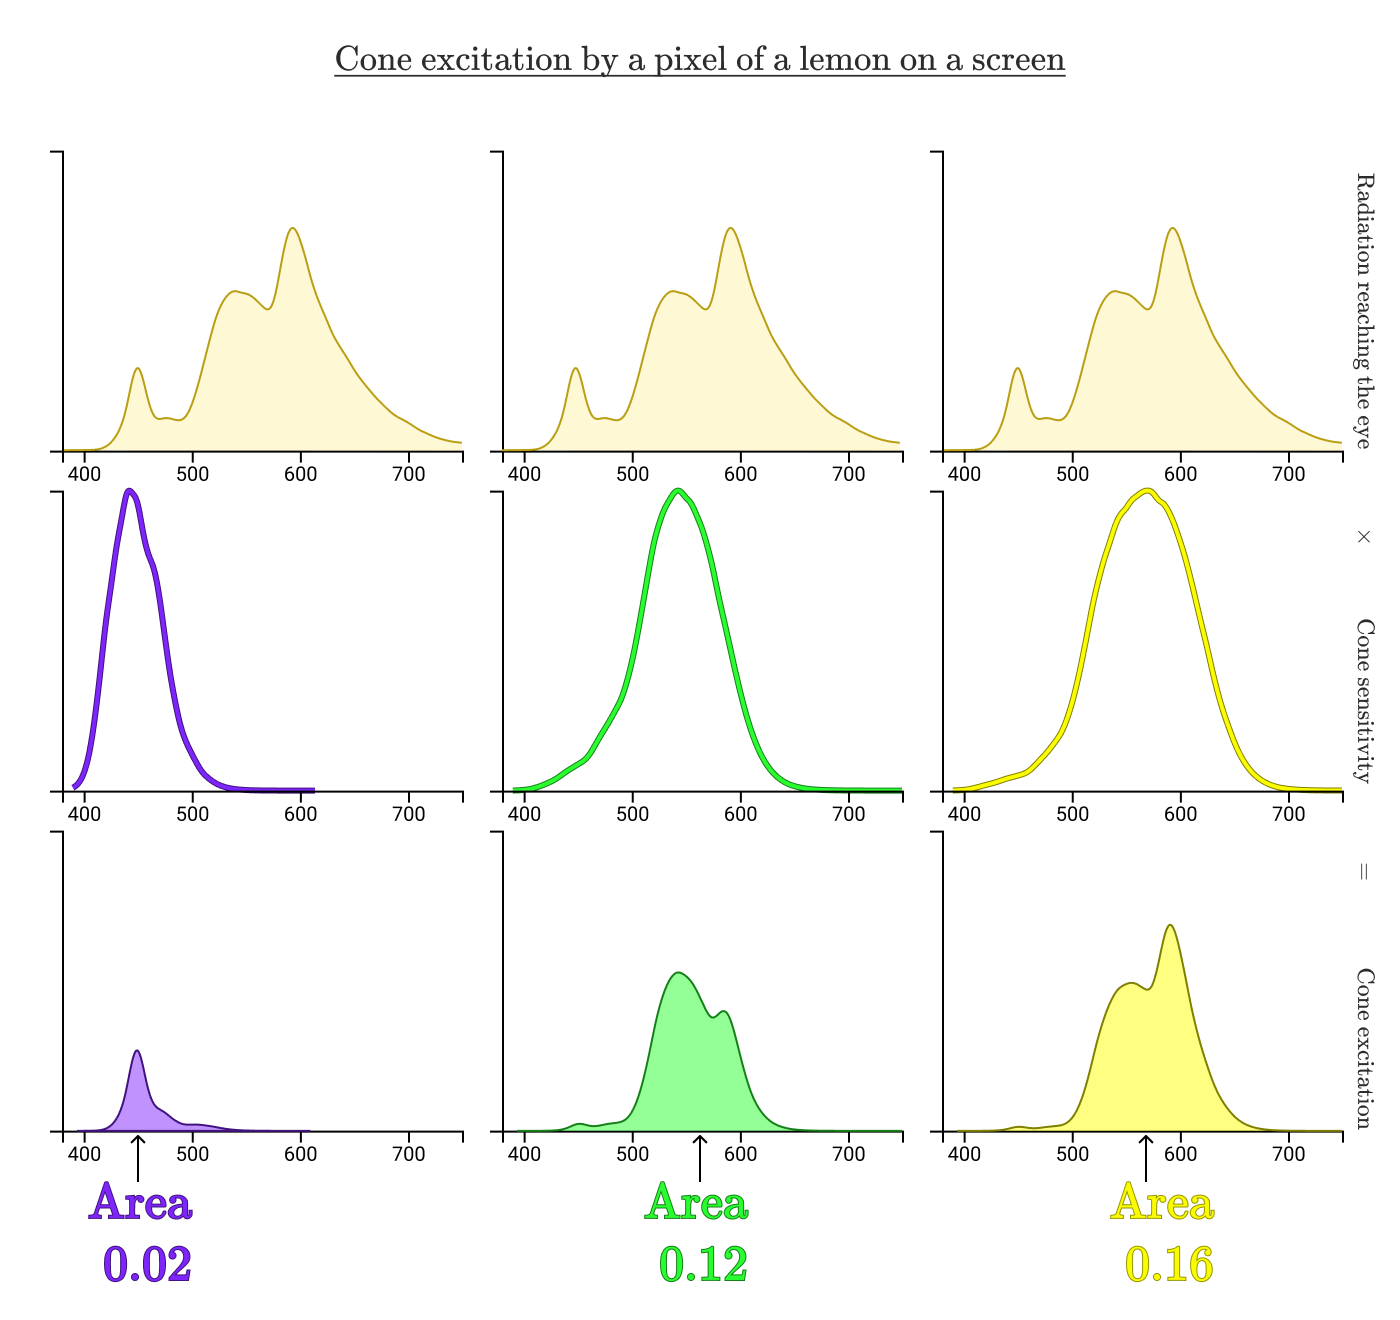 不同的\((S, M, L)\)坐标表示不同的颜色。This is pretty convenient, because \((0.02,0.12,0.16)\) is much easier to communicate than a complicated continuous function. For the mathematically inclined, our eyes are doing a dimensional reduction from an infinite dimensional space into 3 dimensions, which is a pretty damn cool thing to be able to do subconsciously (潜意识地). 将颜色数学化(坐标化,color space)使得我们可以更精确、严谨、方便地处理颜色(混合、复制);当然了这里的降维其实也是一种线性变换。
LMS color space存在的问题:由于三色cone cell响应曲线存在重叠,所以想得到\((0,1,0)\)坐标的颜色是不可能的。A problematic side effect of this fact is that it's really difficult to increase stimulation of only one of the cones. This, in particular, would make it not a great candidate for building display hardware. Another historical, pragmatic problem was that the cone sensitivities weren’t accurately known until the 1990's, and a need to develop a mathematically precise model of color significantly predates that. The first significant progress on that front came about in the late 1920's.
RGB Color Space
Wright & Guild’s color matching experiments:上面的三个灯是单色的,blue和green灯来自Na灯,700 nm来源不知道,应该也是单色的。调节这三个灯的功率使得混合后的颜色和目标波长(下面的灯,应该也是单色的)的颜色匹配。不断变换下面灯的波长,分别测出对应的三色灯的成分比例,于是可以构建【color matching functions 】(CMFs),即\(\bar{r}(\lambda), \bar{g}(\lambda)\), and \(\bar{b}(\lambda)\)。

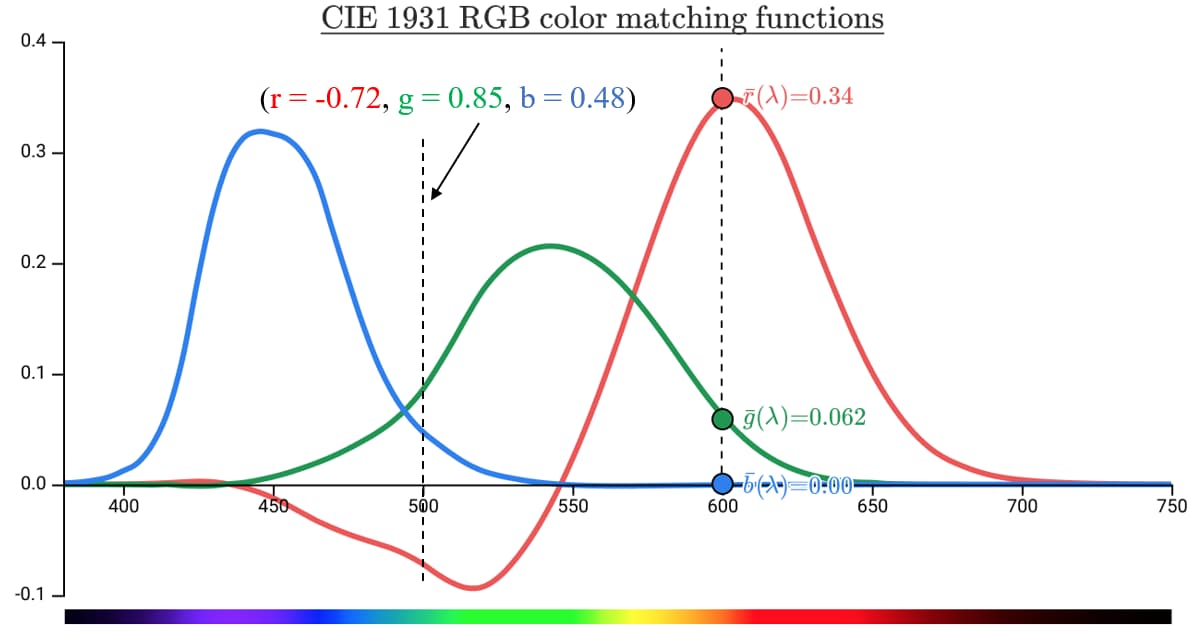
如下图所示,用CMFs去复刻600 nm单色光没问题,三个坐标值都是非负的;但是去复刻500 nm就出现问题了,会发现无论怎么调整三个灯的功率都无法matching,唯一的解决办法就是在目标颜色500 nm上额外增加700 nm,即blue + green = 500 nm + red,等价于 blue + green + (-red) = 500 nm,最终的rgb数值如下图所示。下图中的\(\bar{r}(\lambda), \bar{g}(\lambda)\), and \(\bar{b}(\lambda)\)应该是已经面积归一化过了,\(\bar{r}(\lambda)\)为负值的区域即Spectral colors that can't be accurately reproduced by R, G, B lights (注意限定是上面规定的三原色波长)。
Wright & Guild’s color matching experiments的实验是针对单色光,对于一个宽带光谱而言,也可以得到rgb数值,只需要将光谱和CMFs相乘,然后求积分面积即可。用这种方法处理我们之前的柠檬色,如下图:
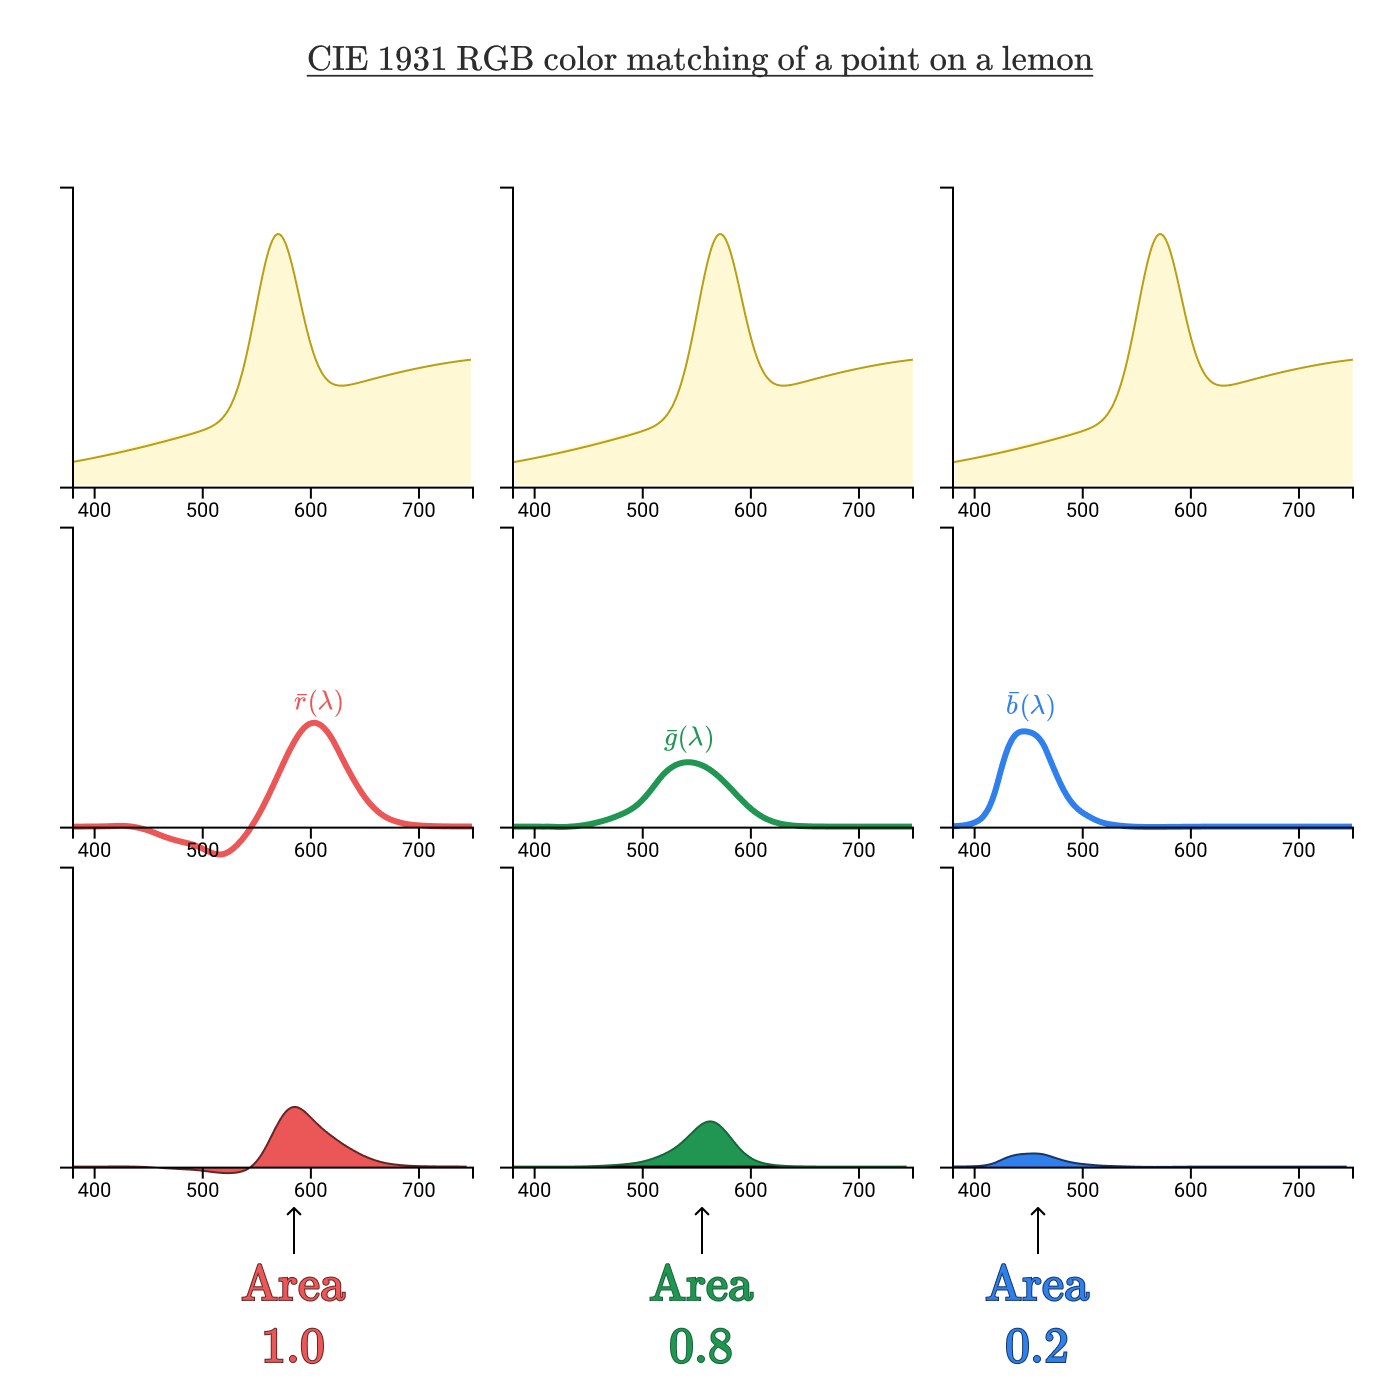 之前的LMS Color Space下柠檬的颜色为(S=0.02, M=0.12, L=0.16),而这里在RGB Color Space下柠檬的颜色(R =1.0, G=0.8, B=0.2)。
Visualizing color spaces & chromaticity
x
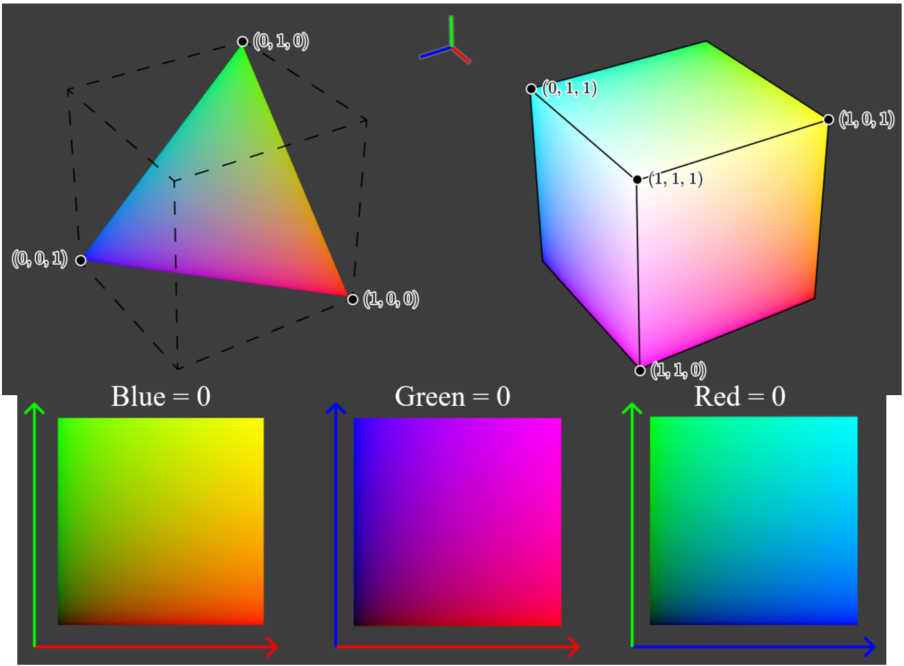
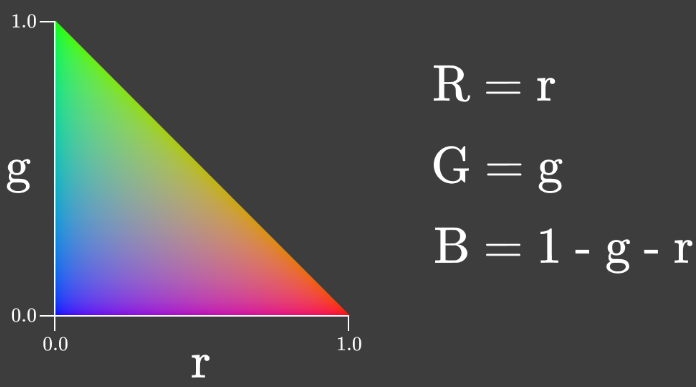
将\(R+G+B=1\)平面投影到rg平面,即得到下图所示。This two dimensional representation of color is called chromaticity. This particular kind is called 【rg chromaticity】(rg色度图). Chromaticity gives us information about the ratio of the primary colors independent of the lightness.
rg chromaticity图可以有不同的intensities (lightness),比如下图,相同的位置在两个图中代表的颜色是相同的,决定颜色的只是三个数值的比例。
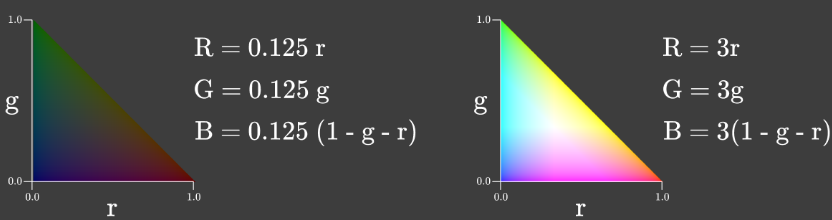
Chromaticity is a useful property of a color to consider because it stays constant as the intensity of a light source changes, so long as the light source retains the same spectral distribution (此处不那么严谨). As you change the brightness of your screen, chromaticity is the thing that stays constant!
HSL and HSV Color Spaces
待补充
CIE XYZ Color Space
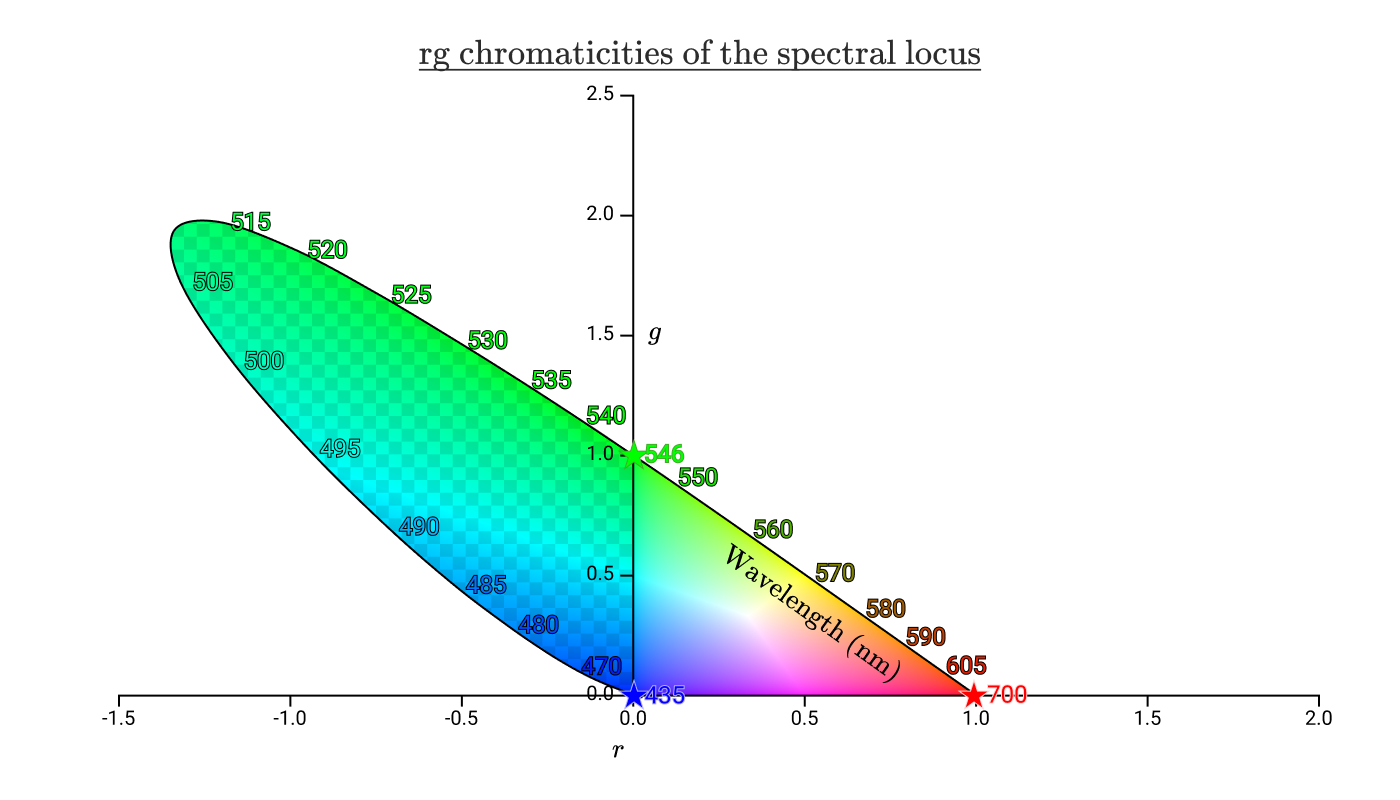
If we take our color matching functions \(\bar{r}(\lambda), \bar{g}(\lambda)\), and \(\bar{b}(\lambda)\) and use them to plot the rg chromaticities of the spectral colors, we end up with a plot like this:
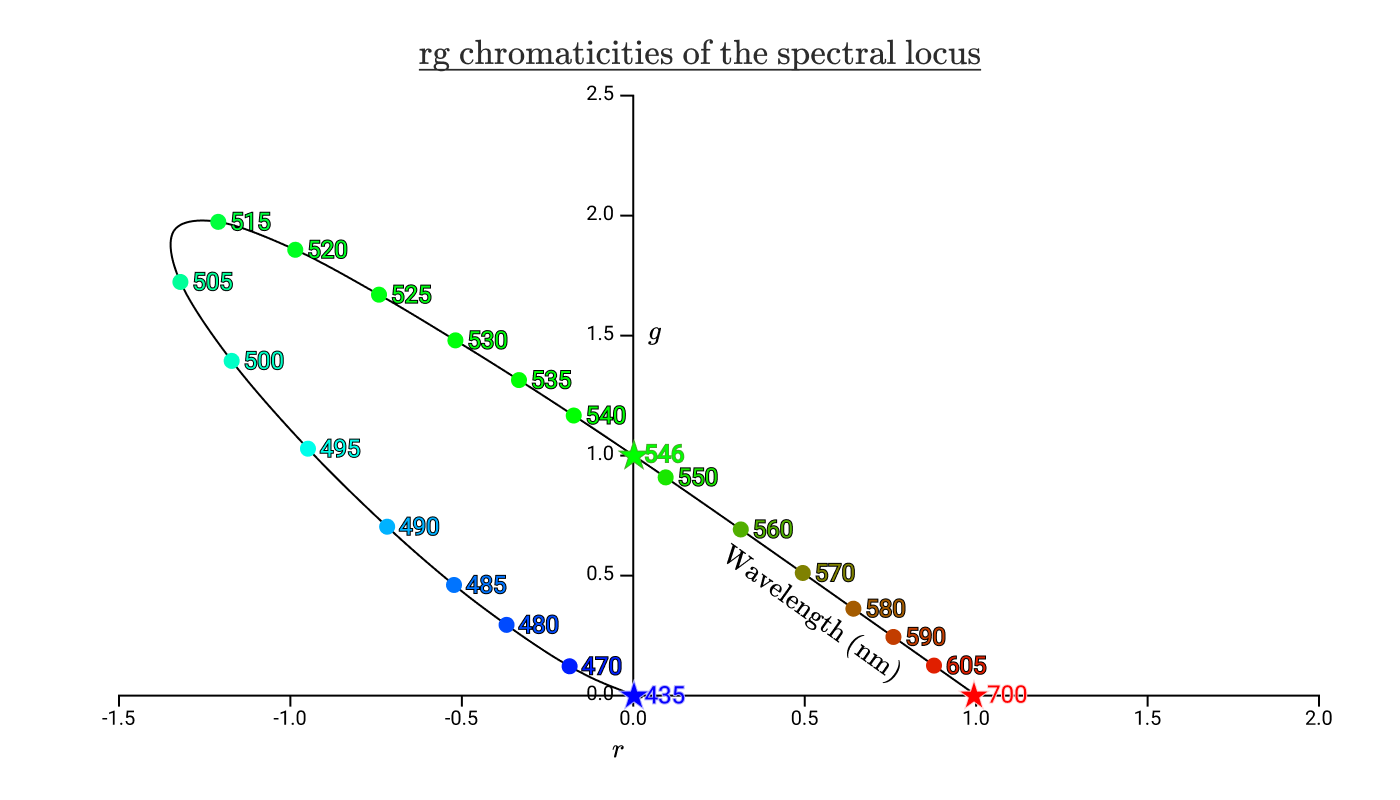 The black curve with the colorful dots on it shows the chromaticities of all the pure spectral colors. The curve is called the 【spectral locus】(光谱轨迹). 光谱轨迹内的区域代表了人类可见的所有色度。The stars mark the wavelengths of the variable power test lamps used in the color matching experiments.
如果我们将之前的色度三角形(rg chromaticity)叠加到该图表上,我们将得到以下结果:
 棋盘区域代表人类可以识别的色度,但无法通过 435nm、546nm 和 700nm 光的任何正组合来再现。从该图中,我们可以看到我们无法再现 435 nm 到 546 nm 之间的任何光谱颜色,其中包括纯青色。右边没有棋盘的三角形是可以通过正组合再现的所有色度。我们将可再现的区域称为色彩空间的色域(gamut)。
In 1931, the International Comission on Illumination convened and created two color spaces. 一个是我们之前讨论过的RGB Color Space,一个就是XYZ Color Space。采用XYZ Color Space的一个好处就是have positive values for all human visible colors, and therefore have all chromaticities fit in the range [0, 1] on both axes. To achieve this, a linear transformation of RGB space was carefully selected. $$ \left[\begin{array}{l} X \\ Y \\ Z \end{array}\right]=\frac{1}{b_{21}}\left[\begin{array}{lll} b_{11} & b_{12} & b_{13} \\ b_{21} & b_{22} & b_{23} \\ b_{31} & b_{32} & b_{33} \end{array}\right]\left[\begin{array}{l} R \\ G \\ B \end{array}\right]=\frac{1}{0.17697}\left[\begin{array}{ccc} 0.49 & 0.31 & 0.20 \\ 0.17697 & 0.81240 & 0.01063 \\ 0.00 & 0.01 & 0.99 \end{array}\right]\left[\begin{array}{l} R \\ G \\ B \end{array}\right] $$
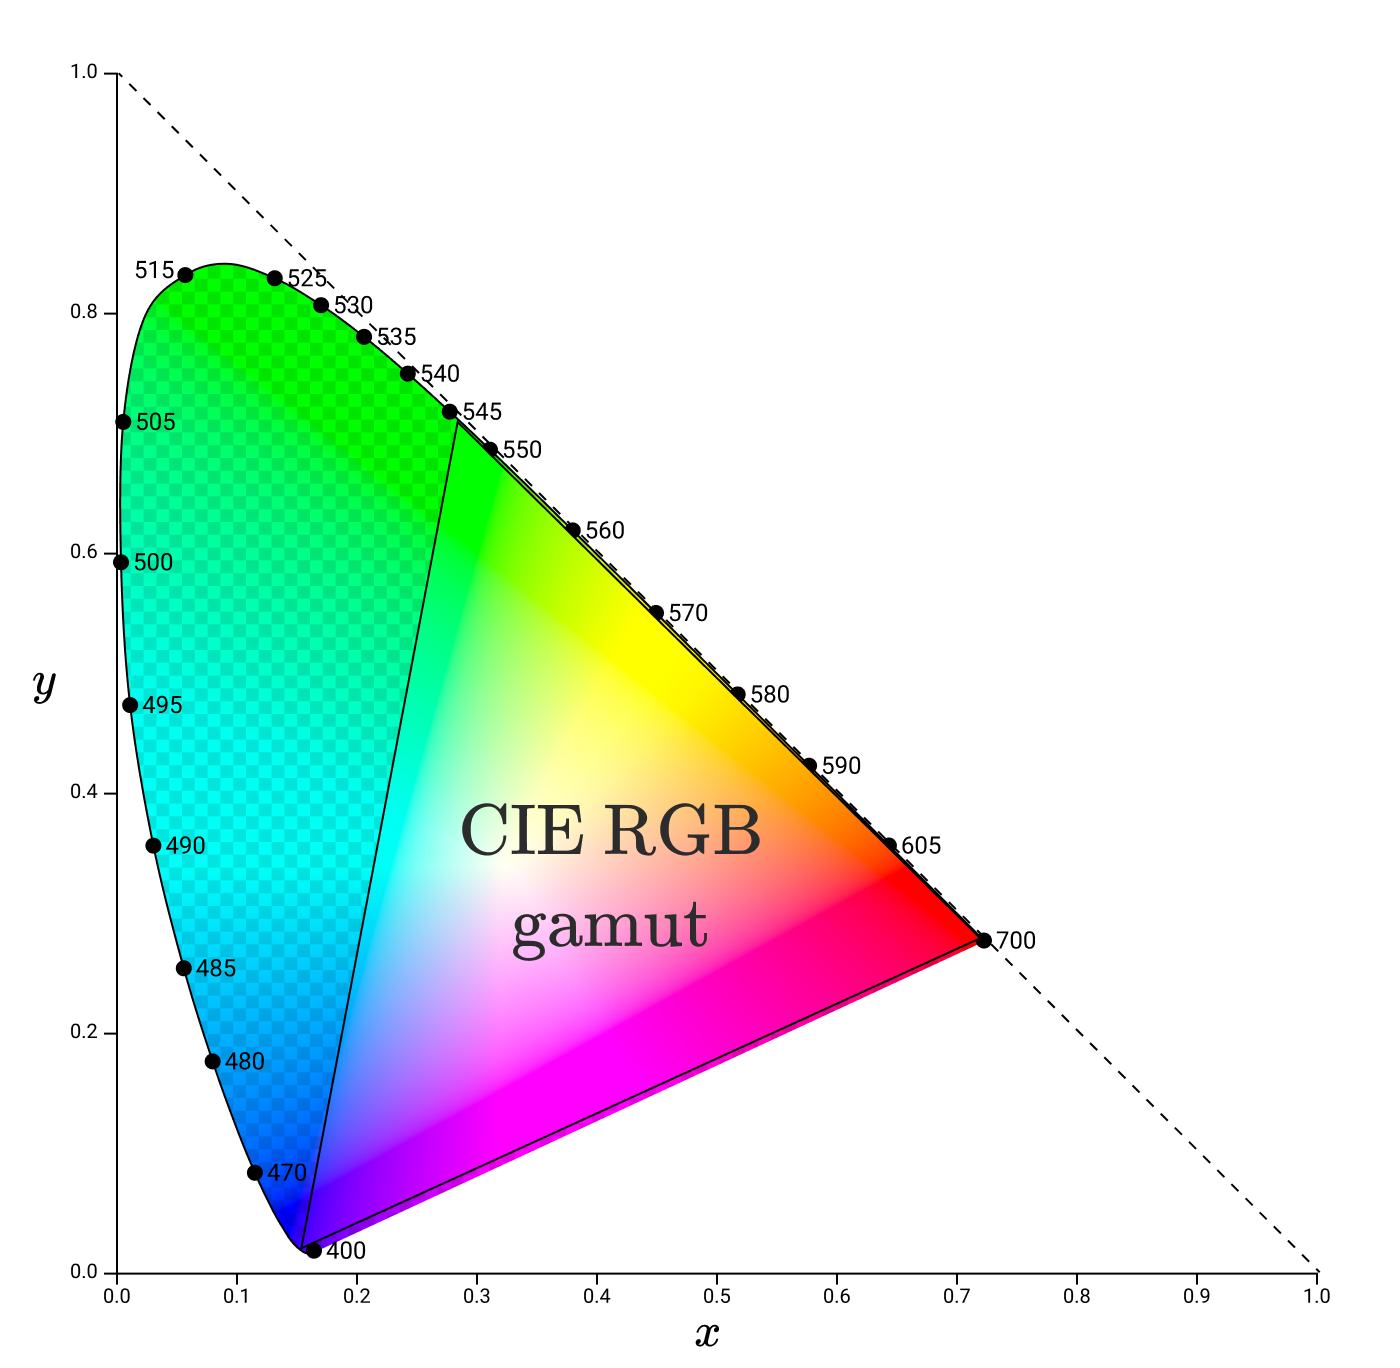
色域通常由放置在 xy 色度图中的三角形表示。如图是Gamut of the CIE RGB primaries and location of primaries on the CIE 1931 xy chromaticity diagram.
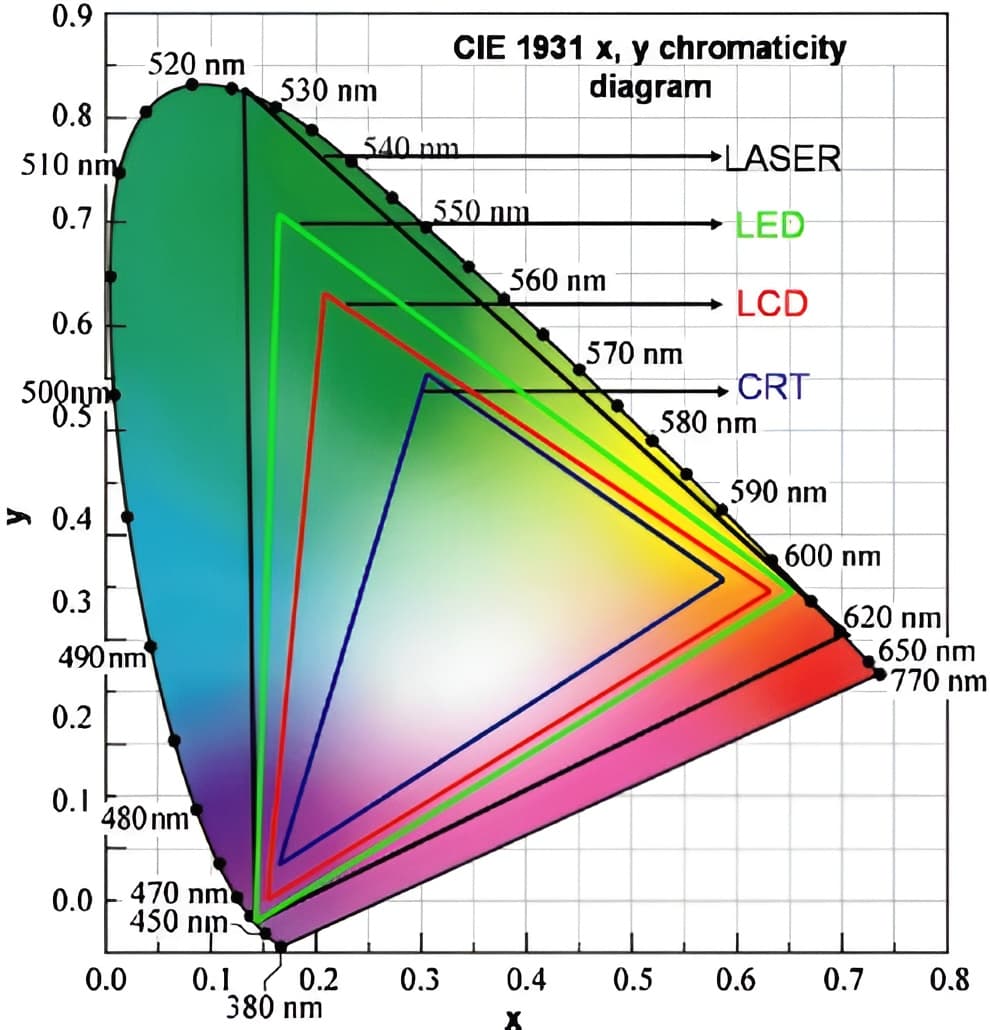
下图是不同的显示器种类大致的色域。
Gamma Correction
人眼需要能see in the very low light as well as very bright light. 相比之下,照相机对 bright light更有效,对 low light不那么有效,这也是为什么相机制造生努力提高相机在弱光下的拍摄效果。
XXX
Gamma 校正的幂函数曲线来自于心理学上的韦伯-费希纳定律(Weber-Fechner Law)或斯蒂文思幂定律(stevens'power law),关于这两个定律,我们在讨论dB分贝的时候已经拓展过,这里不赘述。
Color seems objective at the strat but the way we decribe color might end up needing a little bit brainlike than we might think.
图像类型
颜色模式
(1) RGB 也就是传统的每个点由(x, y, z)组成,三个数的取值都在0到255之间。
(2) RGBA是一种色彩空间的模型,由RGB色彩空间和Alpha通道(透明度,从完全透明的0%到完全不透明的100%)组成,如下图所示。
 (3) CMYK,印刷四色模式是彩色印刷时采用的一种套色模式,利用色料的三原色混色原理,加上黑色油墨,共计四种颜色混合叠加,形成所谓“全彩印刷”。四种标准颜色是:C:Cyan = 青色,又称为‘天蓝色’或是‘湛蓝’;M:Magenta = 品红色,又称为‘洋红色’;Y:Yellow = 黄色;K:blacK=黑色。
(4) YCbCr
(5) 其他的还有像素1位的图(白和纯黑),灰度图(不同程度的黑)等等。
位图和矢量图
(1) 位图
加色模式/减色模式/色相环
参考资料:
(1) PIL库中图像的mode参数
(2) 加色模式、减色模式与色相环的关系是什么?
(3) 位图和矢量图你分的清么?
PIL库的常用操作
利用Python-PIL库的Image模块将RGB矩阵还原成图片
先安装pip install Pillow,然后按照参考资料操作即可。
参考资料:
(1) Python PIL库进行图像处理
(2) PIL/Pillow的安装
(3) Pillow官方文档